Automating vSAN Policy Application: Building the Dashboard 4 of 5
## Introduction:
As we approach the culmination of our series on automating vSAN policy application, this second-to-last blog post is dedicated to the creation of an intuitive and informative dashboard. Dashboards serve as a swift and effective means of presenting crucial information. Let’s delve into the steps of creating a dashboard that brings clarity to vSAN policies.
## Dashboard Creation Process
#### 1. Utilizing Two Views
Our dashboard will incorporate two views, one of which needs to be created manually. The second view comes ready-made out of the box. Both views, along with the dashboard itself, can be downloaded view1 and view2.
#### 2. Dashboard Download Link
To simplify the process, I’ve uploaded the dashboard for direct download here.
#### Configuration File Renaming:
If you’ve renamed the configuration files, as explained in the initial blog of this series, ensure to re-point them in the dashboard. This is crucial for seamless integration.
#### Custom Group Adjustment:
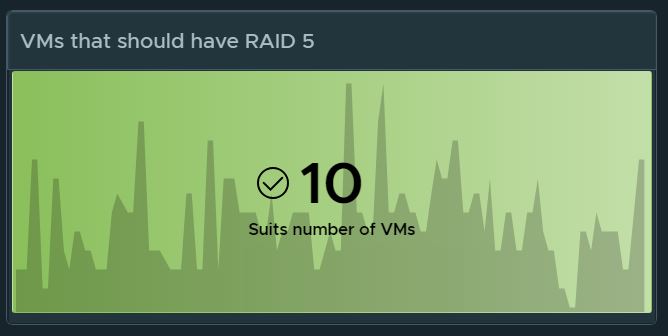
Likewise, if you’ve made changes to custom groups, especially those containing “RAID” in their name, remember to re-point all relevant widgets in the dashboard.
### Data Visibility:
Once everything is configured correctly, every widget on the dashboard should showcase the desired data. Note that data visibility might take up to 20 minutes in some cases.
## Conclusion:
Creating an insightful dashboard is a key step in visualizing the impact of automated vSAN policy application. Download the resources provided, follow the configuration adjustments, and witness your dashboard come to life! Stay tuned for the final blog, where we’ll wrap up the series and highlight key takeaways. 🚀 #vSAN #DashboardCreation #Automation #TechBlog